Rainfall Intensification: The Challenge of Projecting Future Extreme Storms
By Mark Maimone, PhD, PE, D WRE, BCEE, Senior Vice President, CDM Smith and Sebastian Malter, CC-P, Water Resources Engineer, CDM Smith
Posted
in
Featured Projects


Climate change model projections are universally in agreement that temperatures are rising around the globe. One of the most important impacts of a future warmer climate is the projected increase in the frequency and intensity of extreme rainfall events caused by warmer air temperatures, higher atmospheric holding capacity and enhanced surface evaporation. The physical mechanisms linking climate change and extreme storms can result in variable responses, making detection and attribution of trends in extreme storm characteristics difficult. Projecting changes in severe storms is also challenging because of Global and Regional Climate Model limits on grid size that make it hard to capture and represent the small-scale, highly local physics of extreme storms.
Several approaches have emerged over the last few years which are trying to make use of downscaled global and regional climate model projections to project extreme rainfall for several regions across the United States. Approaches range from simple delta change factor methods which only use precipitation output to more complex methods which parameterize GCM output based on temperature, humidity, precipitable water and wind.
CDM Smith’s Climate Adaptation and Modeling Team reviewed the latest extreme precipitation research and analyses of observed precipitation data and performed a comparison analysis using several sources of extreme rainfall projections. Most approaches that depend on GCM precipitation output are now thought to underestimate the magnitude of change in extreme rainfall. Even the higher resolution regional climate models at non-convection-permitting scales still show important deficiencies in their representation of precipitation extremes at sub-daily timescales. To address short-term durations (sub-daily to sub-hourly) events that have a low probability of occurrence (return intervals of 10 years or more), we have developed three practical approaches to estimating intensification due to climate change. All three result in precipitation Delta Change Factors (DCFs) which represent percentage increases over time for extreme rain events due to climate change.
“Top 20-Storm Approach”: based on GCM precipitation output that uses the full suite of available CMIP5 climate models. The 20 largest simulated wet days over each 20-year period are averaged across all GCMs and used to calculate DCFs per decade from 2020 through 2090. This has been done for all 204 HUC4 watersheds within the contiguous US.
“7% Clausius Clapeyron Approach”: This approach makes use of the strength of climate models which are more accurately simulating temperatures than precipitation. The approach is based on the Clausius-Clapeyron rate which assumes 7% increase of atmospheric holding capacity per degree Celsius warming. The approach uses downscaled climate model temperature data and applies the Clausius Clapeyron (CC) principal to the year by year average annual temperature increase. By taking the average temperature for the baseline period, and for each of the 20-year decadal windows, the temperature increase multiplied by 1.07 provides a decade-by-decade delta change factor for a location of interest.
“7%-14% Clausius Clapeyron Approach”: This approach follows the same principle as the previous one but is more nuanced in the sense that it incorporates additional intensification of short term duration rainfall based on two principles found in recent literature.
- Rainfall events appear to increase more per degree Celsius for shorter duration storms (generally durations of less than 24-hours).
- Rainfall events appear to increase more for less frequent extreme events. The greater the return interval, starting around the 1 or 2-year return interval, the greater the rate of intensification.
Thus, the “7%-14% CC approach” assumes that:
- The minimum increase per degree C is represented by the Clausius Clapeyron value of 7%. This is applied to the most frequent (1-year) and longest duration (24-hour) event.
- The greatest increase is referred to in the literature as the super CC value, and has been cited in the range of 12% to 14% per degree C. A 14% increase per degree Celsius is applied to the least frequent (100-year and above) and shortest duration (1-hour) duration.
- All other intersects of duration and frequency are interpolated between these values following the two principles stated above.
Table 1 shows the application of the 7%-14% CC approach for 1 degree Celsius warming. Note the variation in projected extreme rainfall intensities by duration and return interval.

Table 1: example of the 7-14% DCFs by storm duration and storm return interval
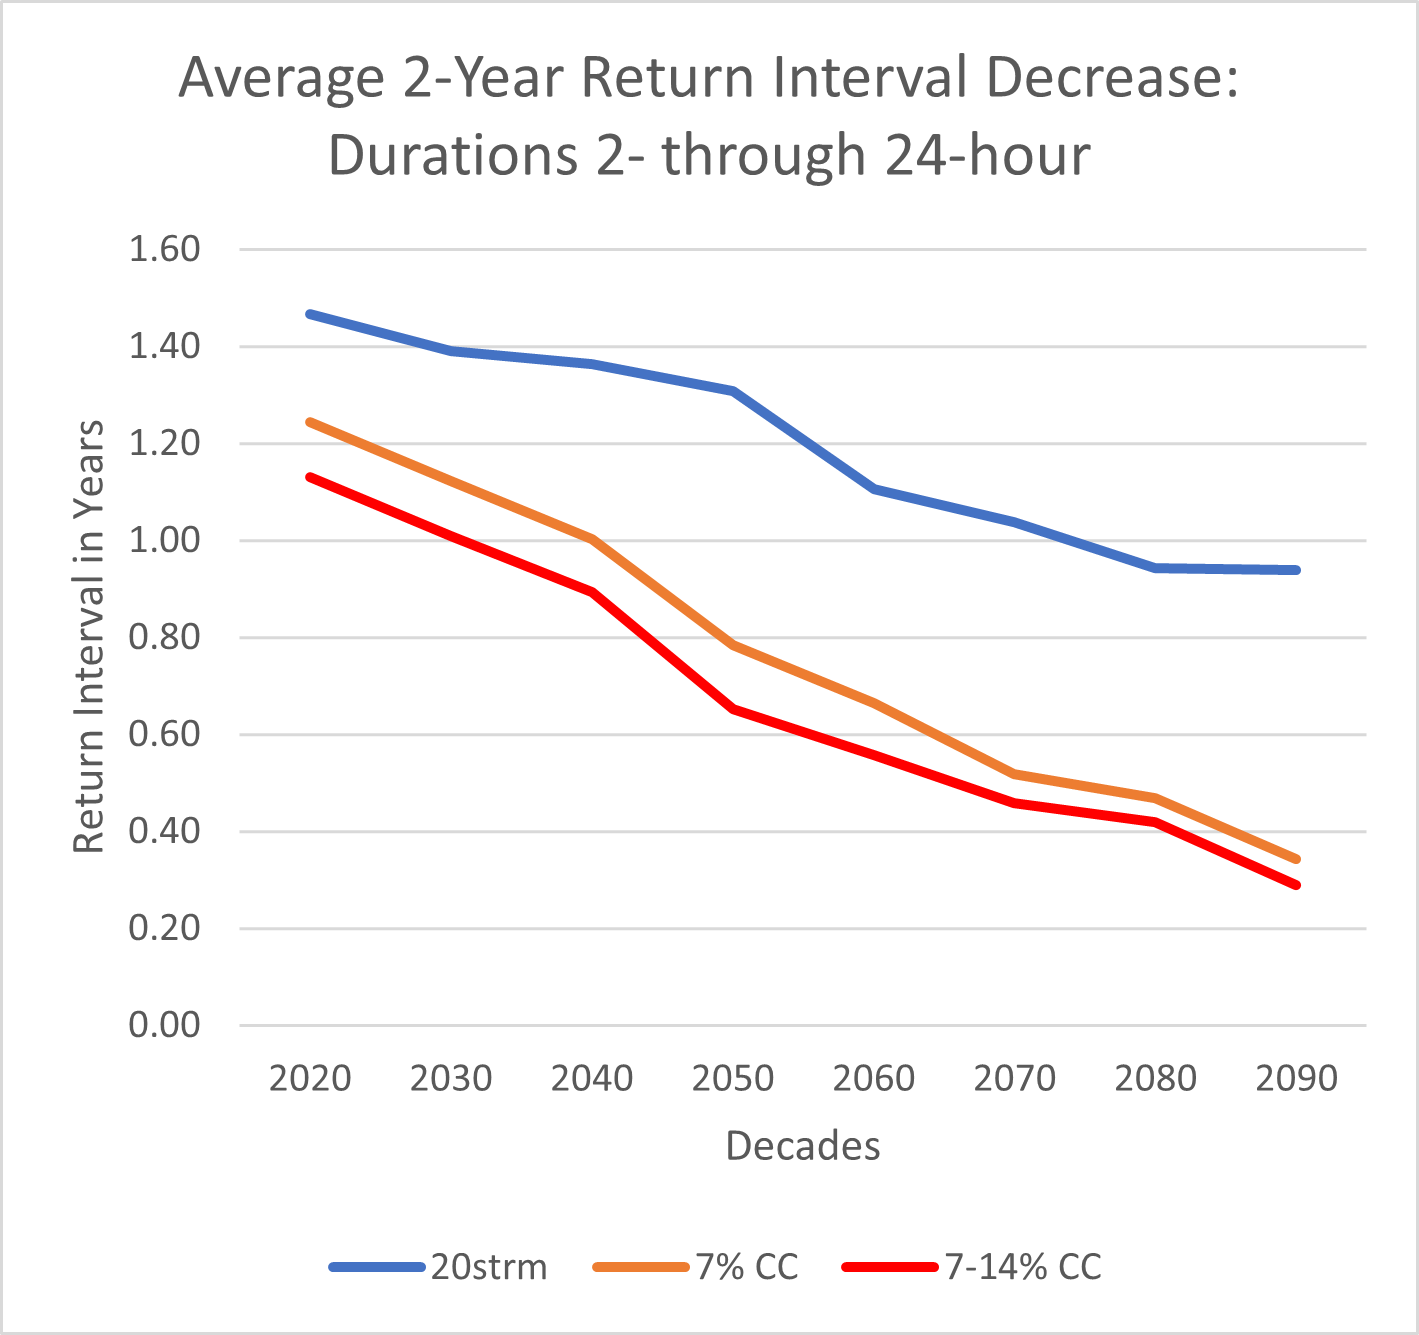
Figure 1 is an example of the application of all three methods to a 24-hour storm listed as a 2-year return storm in Atlas-14 for Philadelphia. Because Atlas-14 in this case used data from the period prior to 2005, the current return interval has already been impacted by climate change. By 2090, the analysis indicates that a 2-year 24-hour rainfall event will likely occur each year, and in the 7%-14% approach, every two months on average.

Figure 1: Example of changing return interval in years for a
24-hour storm due to climate change using all three methods for Philadelphia.
24-hour storm due to climate change using all three methods for Philadelphia.
These methods can be used with any available daily precipitation and temperature projections, such as CMIP5 Localized Constructed Analogs (https://gdo-dcp.ucllnl.org/downscaled_cmip_projections/) and provide a practical way to estimating extreme rainfall event intensification. These methods are relatively easy to implement, can be updated as new science and data emerges and will help in flood management planning in this time of accelerating climate change impacts.